|  |
 |
When atoms of an element are exposed to energy, for example from an electric discharge, some of the energy is absorbed by electrons in the atoms, placing these electrons in excited states. Then the electrons can decay back down to lower energy levels and ultimately to ground state, emitting light at each step. Ground state is the lowest energy level of an atom, and the structure of the atom's energy levels depends on the number of electrons. The difference in energy levels determines the frequency of the emitted photon, which is inverse proportional to its wavelength.
Sometimes, an atom will absorb enough energy to actually strip an electron free, turning the atom into an ion. Ions have their own energy level structures, different from the levels of the neutral atom. A Roman numeral written after the element symbol indicates whether a spectral line originates from the neutral atom or one of its ions. Since an ion has fewer electrons than the neutral atom, its energy level structure will resemble that of a neutral atom of a previous element in the periodic sequence. But because the nuclear charge has not changed, the energy levels will be further apart. A heavier nucleus "holds" electrons more "tightly", requiring more energy to disturb them.
So for example the energy level structure of singly ionized aluminum, written Al II, with its 12 electrons, resembles that of neutral magnesium, written Mg I, also with 12 electrons, but the nuclear charge of aluminum is +13 vs. +12 for magnesium, so Al II will hold onto its electrons with more force than Mg I does. The difference can be illustrated by the most intense line of each spectrum: for Mg I, the transition from the singlet 3s.3p configuration to ground state produces an ultraviolet line at 2852.13Å, while in Al II the same line occurs at 1670.79Å.
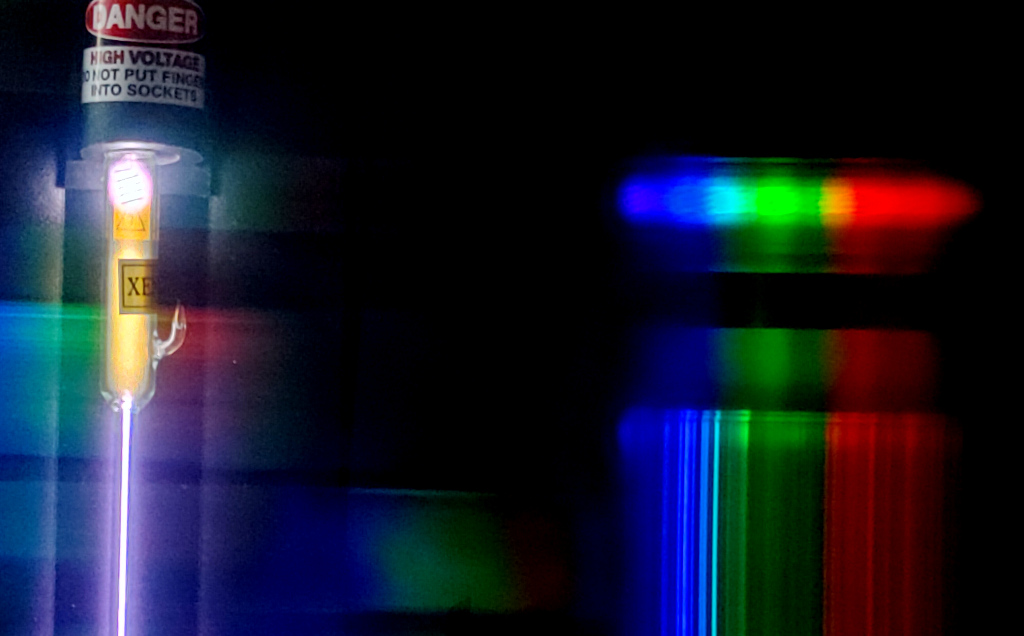
How much ionization happens in a spark or arc depends on several factors, including the amount of input energy. Just as each neutral atom has a ground state and an ionization energy, so too does each ion, and each ionization state is achieved after overcoming the ionization energy of all of the previous states. So when energized, most atoms will typically be neutral atoms, but some will be singly ionized, a few will be doubly ionized, even fewer yet will be triply ionized, and so on. The observed spectrum will contain the lines of as many excited ions as exist in the energized sample, generally decreasing in intensity with increasing ionization. In the photo below, we can see that the lines of Xe II in a xenon discharge are stronger near the extremities of the tube, while Xe I dominates hte narrow region in the center.
|
| |
|
In the interactive viewer, you can specify the relative ionization to display for the selected element spectrum. This will be a rough approximation, in arbitrary units, relative to the degree of ionization in the photographed sample (if applicable), or to the measured sample when relying on NIST line intensities. Values less than 1 will decrease the intensity of ion lines almost linearly; values greater than 1 will saturate the spectrum, approaching a theoretical limit of maximum ion brightness relative to neutral atom brightness. The equation used in code is Hrel = Horig (Z-E+1)-1/a / (Z-E+1)-1, where H is the power density, Z-E+1 equals the Roman numeral of the ionization stage (atomic number minus number of electrons plus one, so 1 or I for a neutral atom), and a is the ionization amount entered by the user. For lines that have not been assigned an ionization number, the intensity is computed with (Z-E+1) = 1.5.
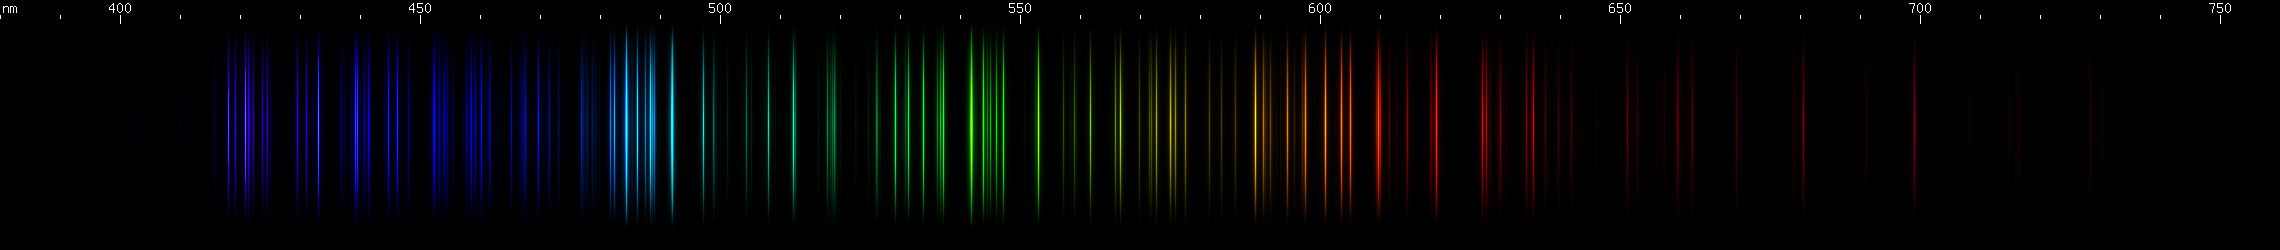
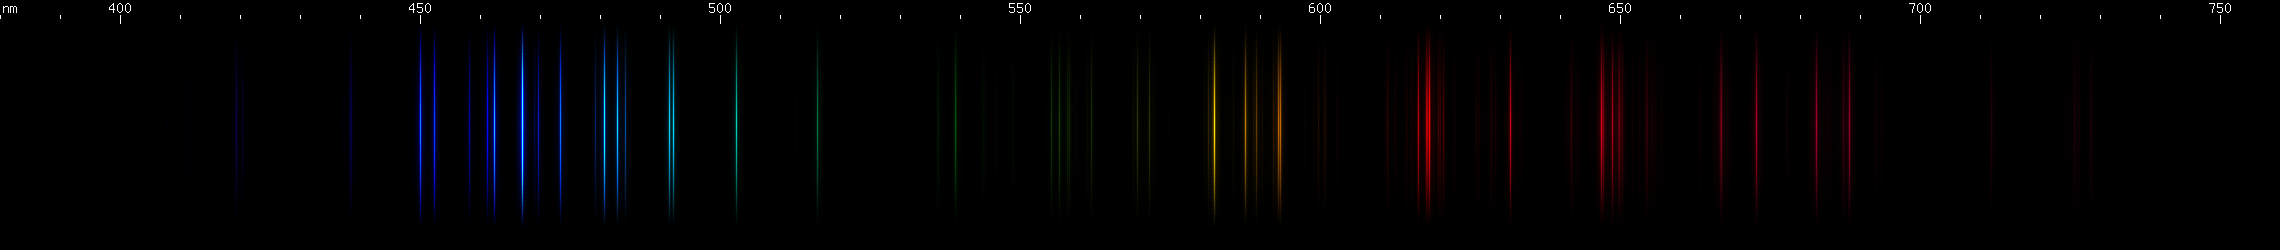
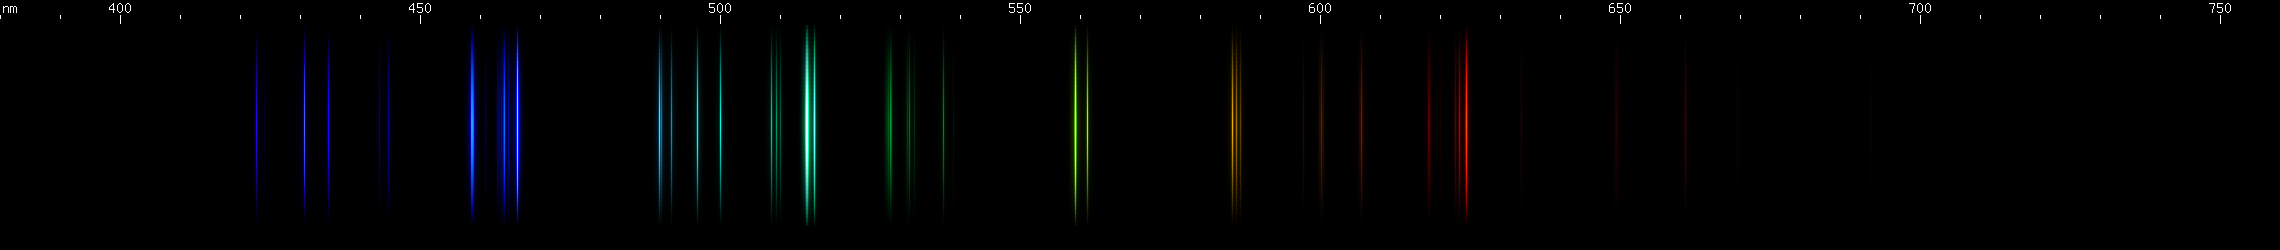
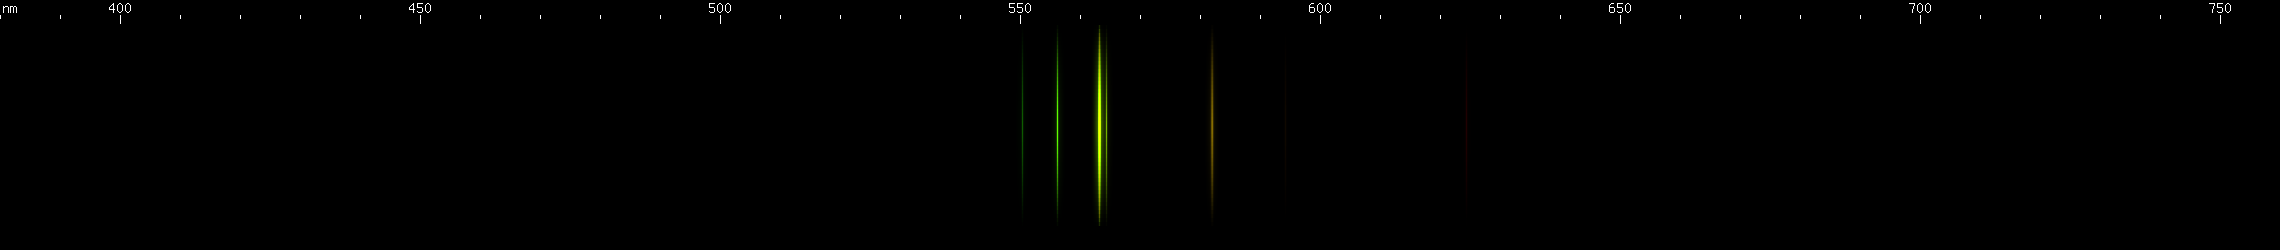
Elements differ in how important the lines of ionized species are. In the case of mercury, for example, we can see that ionization does not contribute very much to its observed visible spectrum under ordinary conditions:
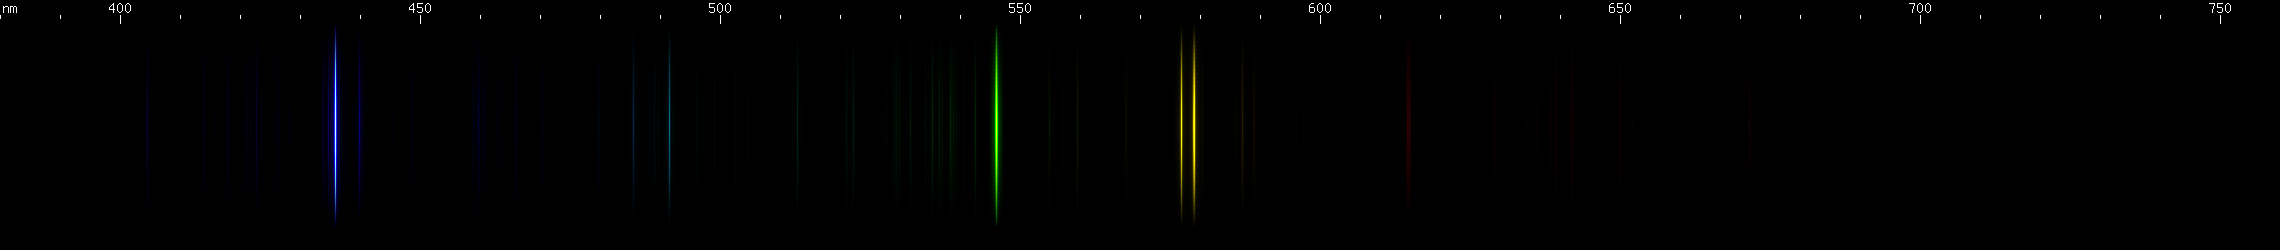
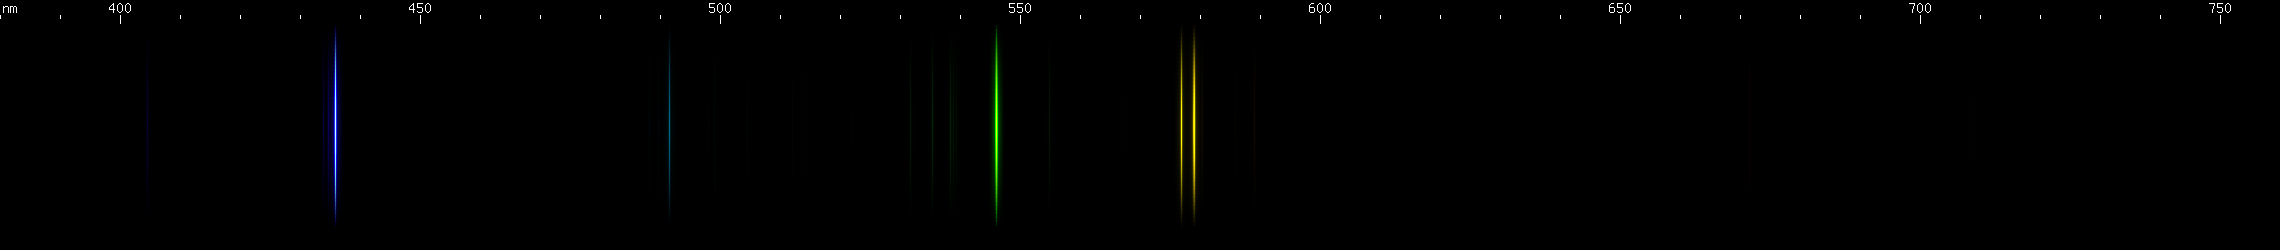
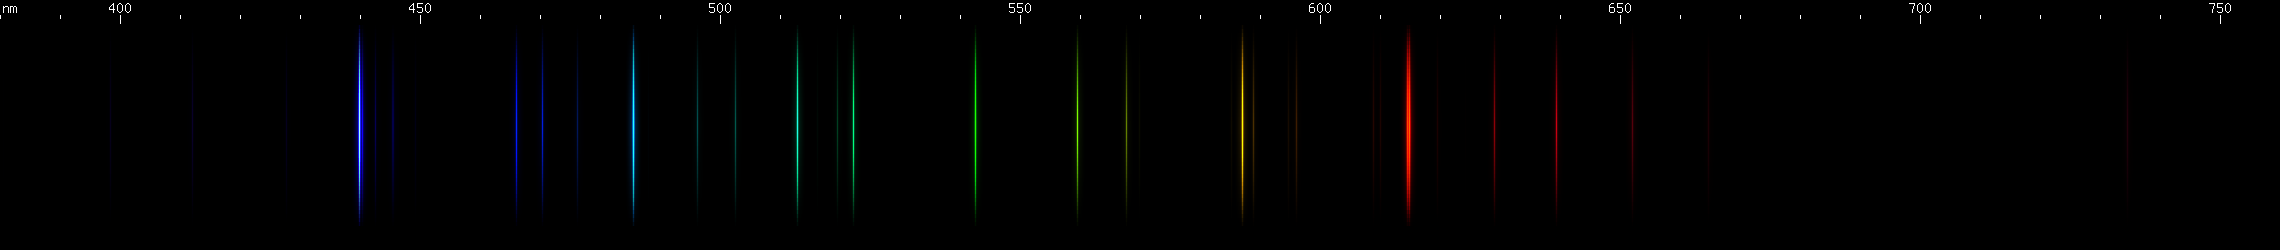
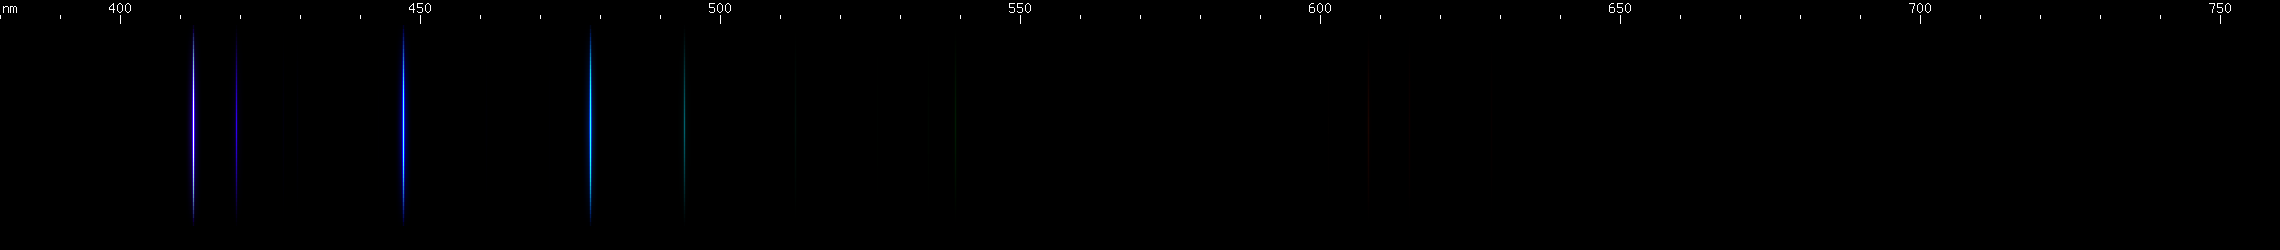
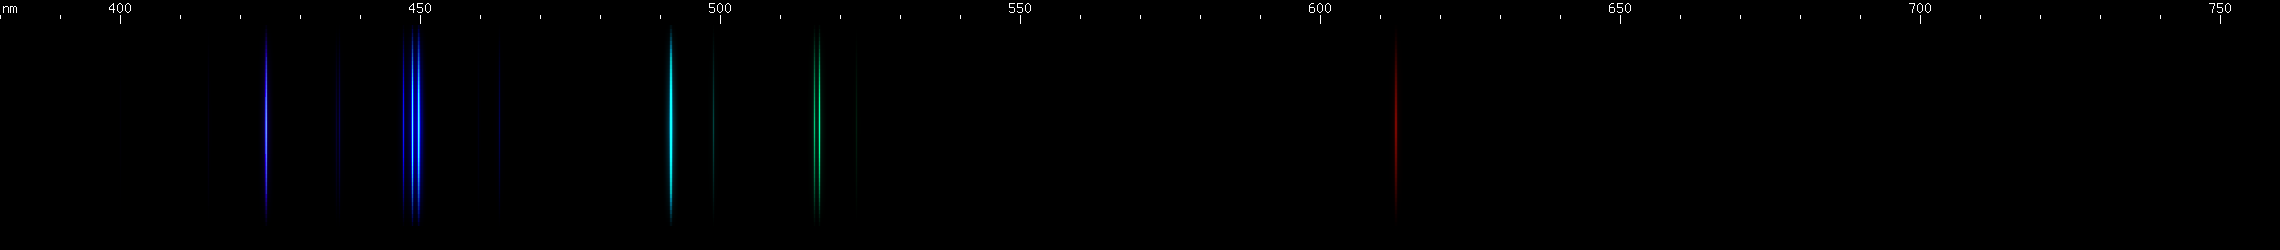
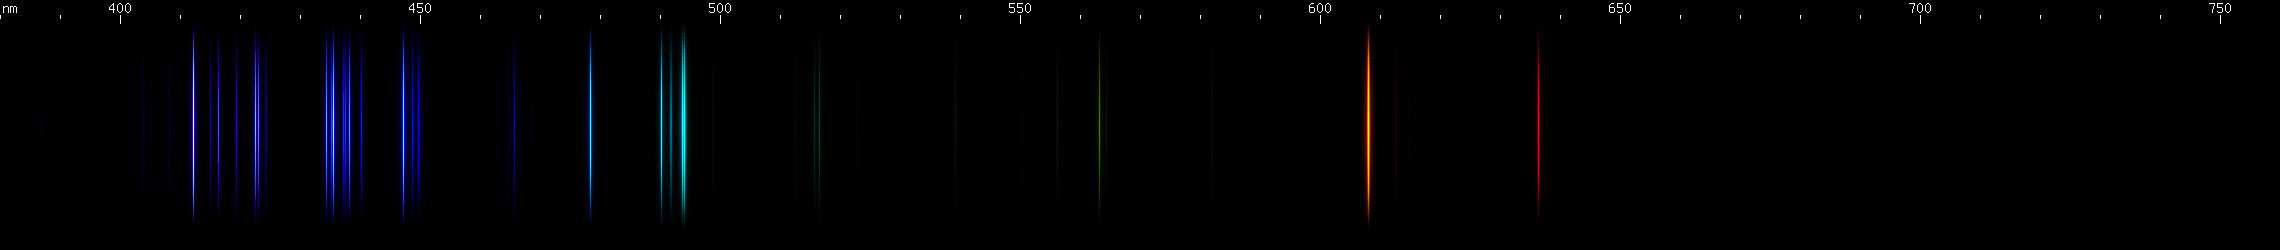
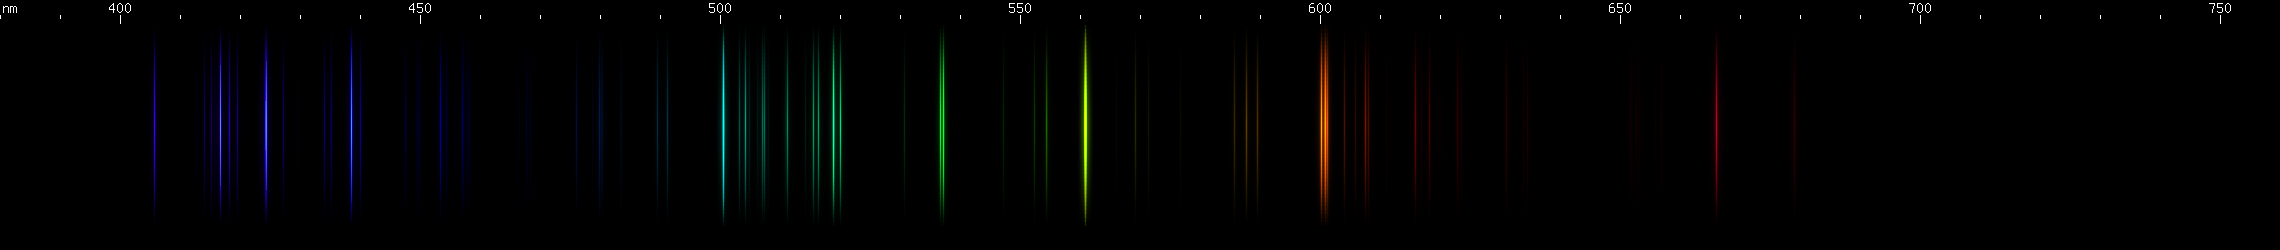
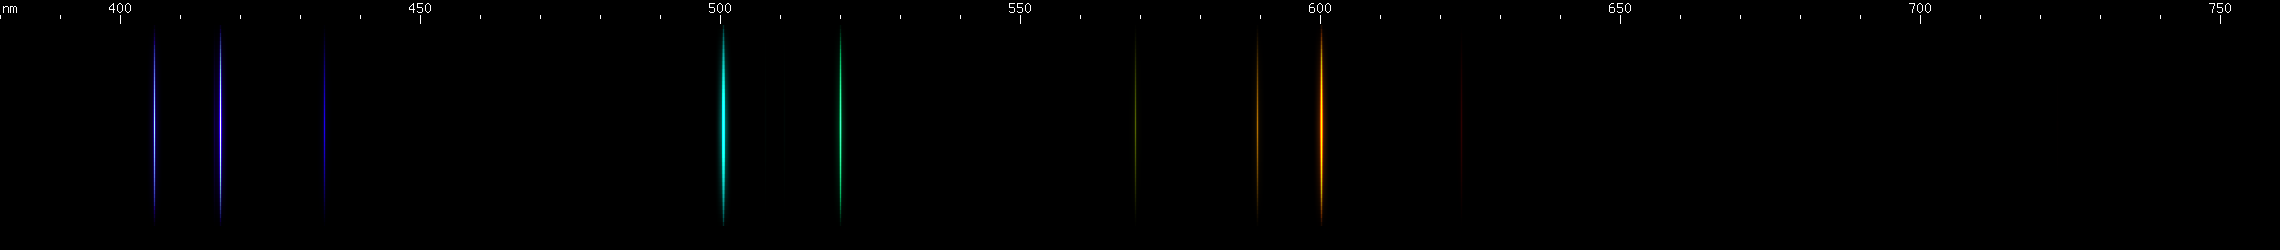
The above spectra have all been normalized to each their own visually brightest line. The top Hg spectrum closely resembles the Hg I spectrum because Hg I has many bright visible lines while the lines of Hg II simply aren't nearly as intense by comparison, so are only faintly visible in the Hg (all) spectrum. Aluminum, by contrast, shows very many bright visible lines from Al II and even Al III, and only a few from Al I:
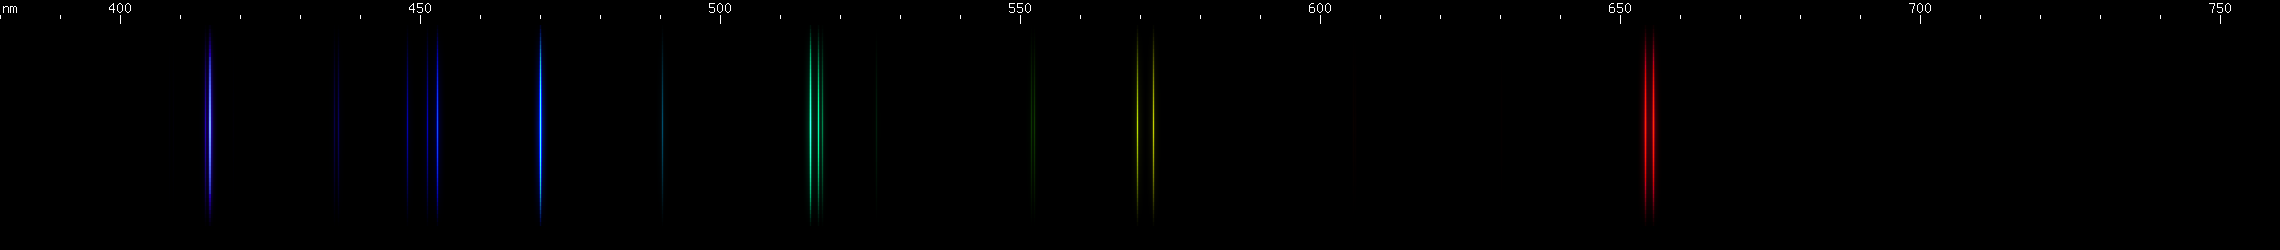
(Not all lines have been assigned to an ionization state, so the top image contains lines not found in the other images.)
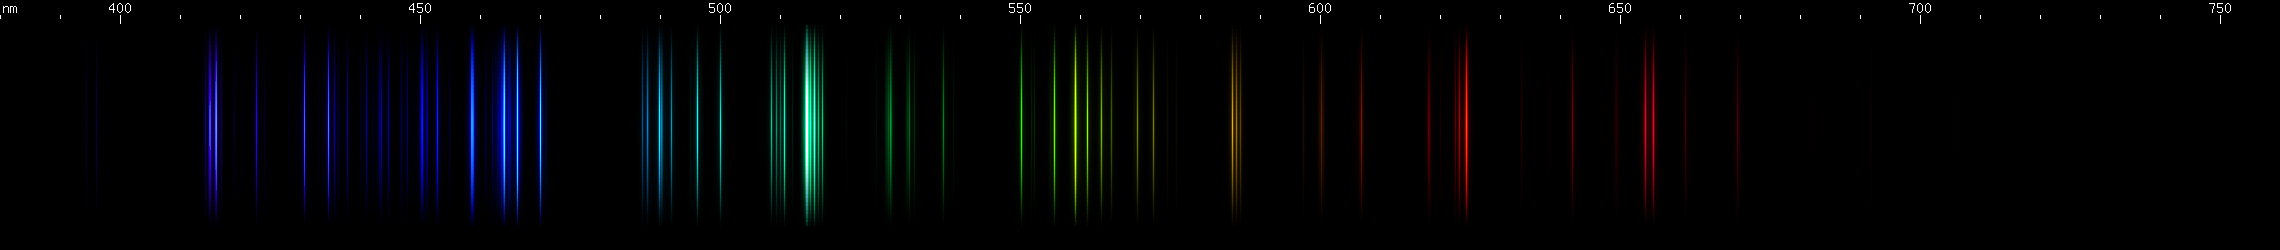
Boron seems an extreme case of ion lines contributing heavily to the appearance of the element's visible spectrum. As I have still been unable to get boron to spark, I cannot verify my sources, and I have only a spectrum from a sample of elemental boron in the flame of a propane torch, showing molecular BO2 bands. The energy level diagram for B I indicates that a single yellow-green line at 563nm should dominate the B I spectrum, but that it should be less intense than a specific infrared line at 1166nm. The IR line is outside the scope of MIT Wavelength Tables (generally my more reliable source for line intensities), and this same source does not mention the 563nm line at all. The NIST data show the 1166nm line as rather dim, and no intensity value at all for the 563nm line. So according to the source data, the atomic boron spectrum, in the visible region, would consist almost entirely of B II and B III.

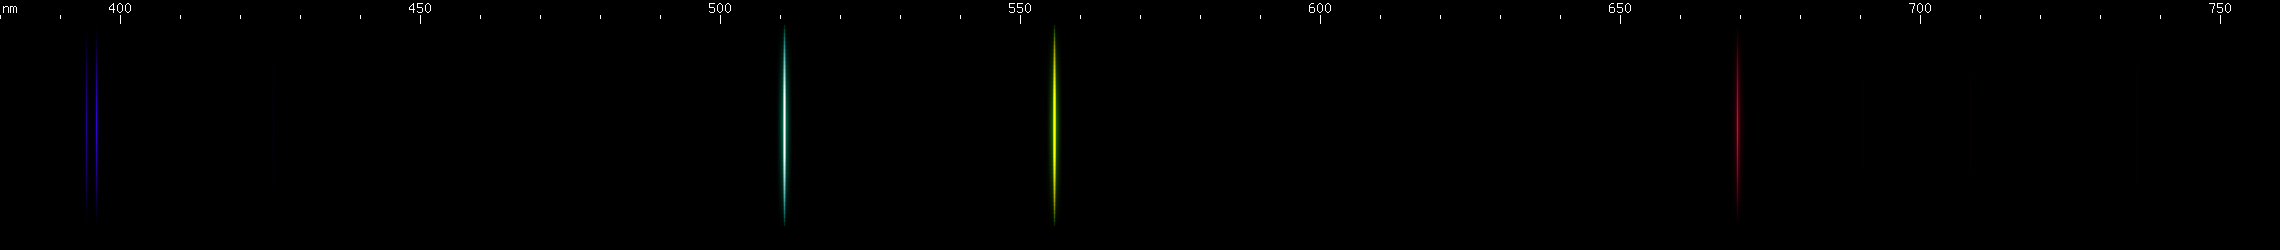
The situation is happily much different in the case of lead, an easy metal to produce clear bright sparks from. Two particularly intense visible lines are known: a deep violet line near 405nm and a greenish-yellow line near 561nm. One of them is due to neutral Pb I, while the other is emitted by Pb II:
Ionization lines can turn up in unexpected places. Lasers, for instance, depend on a populaion inversion, which means more atoms must be in the upper of two energy levels than in the lower level, in order to produce laser light at the wavelength of the line emitted by the transition between the two levels. If more atoms are in the lower level, that wavelength of light will be absorbed too strongly for the laser to work. Intuitively, then, one might expect only the neutral lines of an atomic spectrum to be viable for laser emission, since there are usually more neutral atoms than ions. Indeed, most gas discharge lasers do emit a line of the neutral atom, but the argon ion laser emits its 488nm and 514nm wavelengths from singly ionized Ar II.
Another case where ion wavelengths occur is in the emission of light by phosphors. Since these are crystalline substances, the atoms are close enough together that they interact, sharing some electrons and perturbing the orbitals of other electrons. (The same is true of molecules, however molecular spectra have additional complexity that is beyond the scope of this site.) Most phosphors emit not discrete lines but wide bands of wavelengths; the common strontium aluminate and older zinc sulfide phosphors used as glow-in-the-dark pigments emit bands that span multiple regions of the visible spectrum (e.g. blue-green through orange) with at least one peak wavelength. Complex interactions between the anions and cations of the phosphor matrix perturb the energy levels of electrons in the ions of the trace dopant, producing various colors.
But rare earth phosphors, in which the dopant is a member of the lanthanide series, usually display several emission bands so narrow as to appear to the eye like lines, provided the lanthanide is in the +3 ionization state. (Confusingly, these are written with a Roman numeral III even though the ions are triply ionized, not doubly ionized, so for example Eu(III) in a phosphor actually corresponds to Eu IV in an atomic spectrum.) The narrow discrete bands occur because the 4f electrons of these elements are not strongly perturbed by ns and np valence electrons of the surrounding crystal lattice atoms. Electrons tend to only perturb other electrons in the same or lower orbital, so while p electrons for example will have an effect on the energy levels of both s and p electrons, they will have much less effect on d electrons, and almost none on f electrons.
I wish I could show you Eu IV lines compared to the bands from a Eu(III) activated phosphor, or the equivalent comparison for any other lanthanide, however unfortunately my source data do not include visible or near infrared Ln IV lines for any lanthanide that I've been able to find phosphor bands for. Nevertheless, you can find phosphor spectra of several lanthanide dopants for Y2O3 and YVO4 on the interactive page. Just know that while they are depicted as lines, they are actually bands a few nm wide, that would be hard to see if shown on the screen as bands in such high resolution because of how the energy would spread out across the pixels.
Privacy Policy | Back to home page.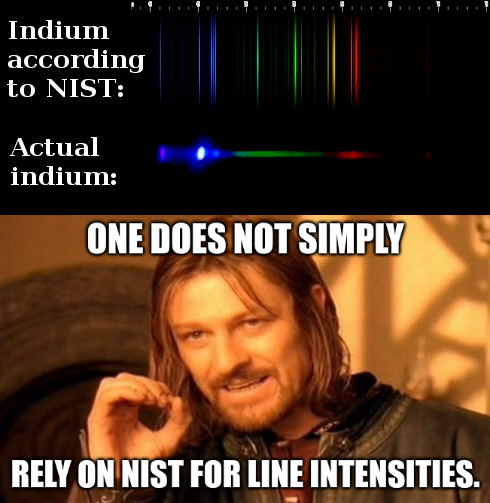